March 2026
Economic and Market Overview
- Global: March was heralded by the Middle East conflict involving US, Israel and Iran. Equity markets traded lower and oil prices rose as investors attempted to assess the duration of the conflict. By month end, no resolution had been reached, however Trump advised on 31 March that he expects the US to end its military campaign in Iran within 2-3 weeks. The conflict prompted markets to reprice rate expectations globally, while oil prices rapidly increased and gold and equities saw declines.
- The market pivoted from pricing interest rate cuts in 2026 from the BoE, to pricing two interest rate hikes before year end. Markets also began to price two 25bp interest rate hikes from the ECB in 2026. For the US, markets moved from pricing 60bps of cuts in 2026 to 7bps.
- Oil prices saw a rapid increase at the beginning of the month, as the market attempted to assess the duration and severity of the conflict, and its impact on global oil supply. Oil prices traded on news headlines for the remainder of the month, however broadly continued to trend higher. Brent closed +63.3% higher at US$118.35/bbl, while WTI increased +51.3% to close at US$101.38/bbl.
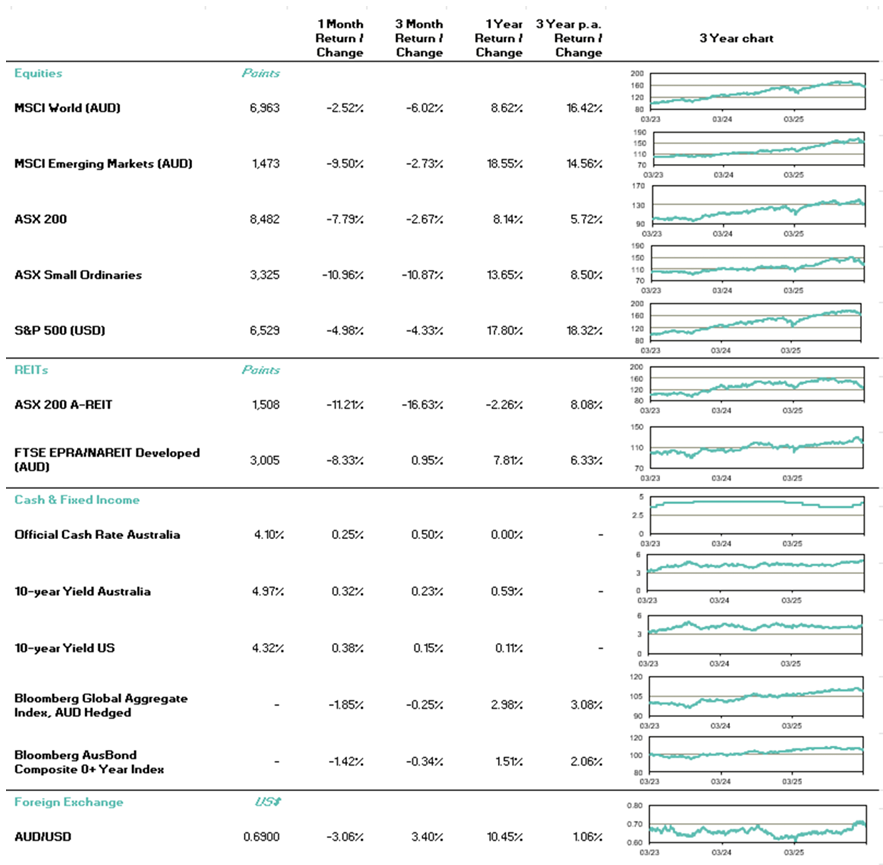
- Global equities traded lower during March, as increased geopolitical uncertainty, higher oil prices and concerns of increased inflation weighed on sentiment. The MSCI World Index declined -6.6%, with all major global indices seeing losses on the month.
Gold prices declined -11.6% during March, amid a shift in global rate expectations and a stronger USD. Gold erased the majority YTD gains, closing the month at US$4668.06/oz.
US: The Fed left interest rates unchanged during March, as widely expected, however revised both inflation and GDP expectations higher. In 2026, the Fed expects real GDP growth of +2.4% (vs +2.3% previously) and core PCE inflation of +2.7% (vs +2.4% previously). Market expectations for interest rates fluctuated throughout the month, oscillating between pricing the chance of a further cut or hike in 2026. By month-end, the market priced a 29% chance of one rate cut by year-end (vs 60bps of cuts at the end of February).
- All three major US equity indices saw declines during month, with the S&P500 -5.1%, NASDAQ -4.8% and DOW -5.4%.
- The DXY strengthened +2.4% during March, supported by higher short-term US rate expectations.
- February nonfarm payrolls fell by -92k jobs, weaker than consensus expectations for +55k job growth. January and December payrolls were also revised downward. The unemployment rate rose from an upwardly revised 4.3% to 4.4%.
- Retail sales fell by -0.2% MoM in January, slightly stronger than consensus expectations for a -0.3% MoM decline.
- February core CPI rose +0.22% MoM, broadly in line with expectations. Headline CPI rose +0.27% MoM, driven by a +0.4% increase in food and +0.6% increase in energy.
The March preliminary Manufacturing PMI increased to 52.4 (from 51.6), above consensus 51.5. The Services PMI declined to 51.1 (from 51.7), below expectations for an increase to 52.0.
Australia: The RBA delivered a 25bp rate hike at its meeting mid-March, as widely expected. The 5-4 vote was relatively dovish, however ongoing geopolitical uncertainty and inflationary concerns prompted the market to price two further 25bp hikes by year-end.
Similar to global peers, the ASX200 declined 7.8% during March, despite the Energy sector advancing +18.5% amid higher oil prices.
The AUD depreciated -3.1% against the USD during March, predominantly as a result of USD strengthening off the back of higher short-term interest rate expectations in the US.
- Q4 GDP growth of +0.8% QoQ was in line with expectations, however yearly GDP accelerated by +2.6%, stronger than consensus expectations for +2.3% YoY. This was attributable to revisions and base effects that influenced the yearly number. However, household consumption grew by +0.3% QoQ, lower than expectations for +1.3% QoQ.
- Household spending increased by +0.3% MoM in January, slightly below consensus expectations for +0.4% MoM.
- In February, employment increased by +48.9k jobs, above consensus +20k. Despite this, the unemployment rate increased to 4.3% (higher than expectations for 4.1%), driven by an increase in the participation rate. The participation rate increased to 66.9% in February, from 66.7% prior.
February headline CPI was flat MoM, however annual headline CPI ticked lower to +3.7% YoY, slightly below consensus expectations for +3.8% YoY.
New Zealand: Q4 GDP increased by +0.2%, softer than consensus expectations for +0.5%. Annual growth of +1.3% YoY was below consensus for +1.7% YoY. Q3 GDP was revised down to +0.9% from +1.1% previously.
Europe: The ECB kept interest rates on hold, as expected, however advised that it would consider hiking rates according to the duration of conflict in the Middle East, intensity of the supply shock and magnitude of second order impacts to the economy.
- The Bank of England held interest rates at 3.7%, however diverged from previously dovish bias to deliver hawkish messaging. The vote split was 9-0, with committee members discussing potential interest rate hikes. At the beginning of the month, two further interest rate cuts were priced in by the market for 2026. This changed to pricing two 25bp hikes by year-end.
- European equities declined during March, with the STOXX600 down 8.0%, while the UK’s FTSE100 fell 6.7%.
- The Eurozone unemployment rate ticked higher to 6.1% in January, slightly higher than expectations for 6.2%.
February preliminary Eurozone CPI accelerated to +0.7% MoM, above expectations for +0.5% MoM. On an annual basis, CPI accelerated to +1.9% YoY, above consensus +1.7% YoY.
China: China’s National People’s Congress downgraded its annual growth target for the first time in four years. GDP growth expectations were downgraded to 4.5% - 5%, from ~5% in 2025.
- China’s 15th Five-Year Plan was approved by the NPC, which prioritised technological adoption and industrial development.
- Trade data in the first two months of the year beat consensus expectations, with exports up +21.8% YoY and imports up +19.8% YoY. This was significantly higher than expectations for +7.2% YoY and +7.0% YoY respectively. Consequently, the trade surplus reached US$213.6bn vs expectations for US$176.1bn.
- CPI increased to +1.3% YoY in February, above expectations for an increase to +0.9% YoY.
Australian dollar
- After gaining 2.2% against the USD in February, the AUD ended March at 0.6900, losing -3.1% over the month.
- AUDUSD traded a 354-pip range, touching a high of 0.7187 on 11 March and trading a low of 0.6833 on 30 March.
- The USD strengthened in March, supported higher short-term interest rate expectations in the US, as the market priced out the 60bps of interest rate cuts it had previously expected. By month end, ~7bps of cuts were priced. The DXY appreciated 2.4% in March.
- The AUD weakened following global risk off sentiment as the conflict in the Middle East progressed throughout the month, and optimism for a quick resolution faded.
- The RBA delivered a widely expected 25bp hike mid-March, providing support to the AUD. Market pricing for two additional rate hikes in 2026 further provide support for the AUD.
- Looking ahead, FX markets remain sensitive to geopolitical developments, with ongoing tensions in the Middle East continuing to drive periods of heightened volatility and risk off sentiment. Volatility is likely to persist near term, with geopolitical risk remaining a key factor for FX markets.
Australian equities
- The ASX200 traded 7.8% lower on the month, tracking global equities lower amid the ongoing conflict in the Middle East.
- Materials saw the largest percentage loss, down 14.1%, with the sector paring YTD gains, finishing the quarter +2.5% higher. Gold miners weighed on the sector as they tracked a 11.6% decline in gold prices throughout the month. EVN -23.9%, NST -32.8%, NEM -14.5%. Elsewhere, copper stocks declined, following a 7.6% decrease in copper prices as expectations for global growth moderated. CSC -29.8%, SFR -20.6%.
- Energy stocks bucked the trend, trading 18.5% higher as oil and gas stocks saw gains amid higher oil prices. WDS and STO gained 23.8% and 17.8% respectively during March.
- Consumer Discretionary stocks saw losses as the market assessed the impact of higher expected inflation on household discretionary spending. The sector declined -8.9% on the month. JBH -11.8%, SUL -17.5%, HVN -14.4%.
- The tech complex continued to see declines, down -12.6% in March as higher interest rate expectations compounded existing AI disruption fears. WTC -20.0%, NXT -18.4%, 360 -23.6%.
- Consumer Staples were mixed, with the sector trading +0.3% higher in March. Defensive supermarkets COL and WOW advanced +6.8% and +1.1%. Elsewhere in the sector, EDV declined -16.6%. At the beginning of the month, EDV reported a largely in line H1 result, however sales growth in the first seven weeks of H2 was +1.3%, below consensus expectations for +1.8%. The stock traded lower for the remainder of the month.
- TLX outperformed the healthcare sector (which fell -7.1%), up +36.6% on the month after announcing both FDA resubmission for Pixclara, and safety data for its TLX591 pipeline asset.
Global equities
- Global equities traded lower in March, with the MSCI World Index declining -6.6% on the month. Asian equities saw the largest percentage loss, with the MSCI Asia Pacific Index down -13.4%, driven by Korea (-18.3%), Japan (-12.8%) and Taiwan (-10.3%).
- US equities pared losses in the last trading session of the month following headlines that Trump expected the US to leave the Middle East over the next few weeks. Despite the relief rally, all major indices closed down on the month. S&P500 -5.1%, NASDAQ -4.8% and DOW -5.4%.
- European stocks also saw declines, with the STOXX600 down -8.0%, while the FTSE100 declined -6.7%.
- Real Estate saw the largest percentage decline on the STOXX600, down -14.5% following an over 100bp change in interest rate expectations by year-end.
- Globally, Energy diverged from other sectors, with oil and gas stocks seeing strong gains amid an over 50% increase in oil prices.
- All other sectors saw losses on the month, with retail and consumer discretionary stocks seeing losses as the market considered the impact of expected higher inflation on household discretionary spending.
- Airlines also declined, amid a combination of higher fuel prices and air space disruption in the Middle East. Easyjet -25.2%, Southwest Airlines -23.7%, IAG -17.4%.
- Semiconductor related stocks declined following a pullback in DRAM prices. DRAM prices declined following the announcement of Google’s TurboQuant, a new efficiency technique that prompted concerns of dampened AI memory/compute demand. Micron -18.1%, Infineon -17.1%.
- European Auto and Parts stocks traded -12.7% lower on concerns of higher interest rates, energy and input material costs. Volkswagen -14.6%, Porsche -13.8%.
Property securities
- After a strong start to the year, Global property securities faltered in March, closing down -9.0% due to renewed inflation concerns driven by rising fuel prices and the Iran war, as well as closure of the Strait of Hormuz. This followed strong February performance of +7.4% and gains in January of +4.1%. As such, the index closed broadly flat YTD at end of March.
- The Americas region continued its outperformance trend from February, however declined -6.0% in March, following a strong +8.5% in February and +3.4% in January. The outperformance may have reflected buying of the sector, given underperformance from last year and rate cuts expected in the US (albeit rate cuts were progressively priced out throughout the month).
- Europe/UK returns were the weakest in March across all global regions, down -16.0% and eroding the +7.2% gains from February, and +5.0% gains from January. This was primarily on concerns of higher refinancing costs driven by rising bond yields, as well as higher fuel and energy costs.
- The Asia Pacific region again underperformed global peers, down ~14% (having gained ~5% in each January and February). This was primarily due to rising oil prices and subsequent higher inflation expectations across the region.
- Locally, AREITs were down -11.0% in March, following a -4.0% decline in February and -3.0% in January, following the second consecutive rate hike by the RBA, and two additional rate hikes being priced in by the market by month-end due to higher oil prices and rising inflation expectations.
Fixed income and credit
- Throughout March, markets repriced interest rate expectations from central banks globally amid expectations for higher inflation. Expectations pivoted from pricing further cuts from the BoE to expecting two hikes in 2026. Market pricing for the Fed pulled back from expecting 60bps of cuts in 2026 to 7bps. For the ECB, the market began to price two interest rate hikes this year, after a period of unchanged rate expectations.
- US 2y Treasury yields closed 41.8bps higher at 3.796%. US 10y Treasury yields closed 37.8bps higher at 4.319%.
- The RBA delivered a 25bp interest rate hike, as widely expected. Similar to other central banks globally, the market progressively priced the chance of further interest rate hikes during March, with two further 25bp interest rate hikes expected by year end.
- The AU 2yr government bond yield closed 47.5bps higher at 4.661%, while the AU 10yr government bond yield closed 32.3bps higher at 4.974%.
- US investment grade credit widened 7.2bps during March. Similarly, US high yield credit widened 53.4bps.
First Sentier Investors
Important information
This material is for general information purposes only. It does not constitute investment or financial advice and does not take into account any specific investment objectives, financial situation or needs. This is not an offer to provide asset management services, is not a recommendation or an offer or solicitation to buy, hold or sell any security or to execute any agreement for portfolio management or investment advisory services and this material has not been prepared in connection with any such offer. Before making any investment decision you should consider, with the assistance of a financial advisor, your individual investment needs, objectives and financial situation.
We have taken reasonable care to ensure that this material is accurate, current, and complete and fit for its intended purpose and audience as at the date of publication. No assurance is given or liability accepted regarding the accuracy, validity or completeness of this material and we do not undertake to update it in future if circumstances change.
To the extent this material contains any expression of opinion or forward-looking statements, such opinions and statements are based on assumptions, matters and sources believed to be true and reliable at the time of publication only. This material reflects the views of the individual writers only. Those views may change, may not prove to be valid and may not reflect the views of everyone at First Sentier Group.
About First Sentier Group
References to ‘we’, ‘us’ or ‘our’ are references to First Sentier Group, a global asset management business which is ultimately owned by Mitsubishi UFJ Financial Group. Certain of our investment teams operate under the trading names AlbaCore Capital Group, First Sentier Investors, FSSA Investment Managers, Stewart Investors, RQI Investors and Igneo Infrastructure Partners, all of which are part of the First Sentier Group. RQI branded strategies, investment products and services are not available in Germany. We communicate and conduct business through different legal entities in different locations. This material is communicated in:
- Australia and New Zealand by First Sentier Investors (Australia) IM Ltd, authorised and regulated in Australia by the Australian Securities and Investments Commission (AFSL 289017; ABN 89 114 194311).
- European Economic Area by First Sentier Investors (Ireland) Limited, authorised and regulated in Ireland by the Central Bank of Ireland (CBI reg no. C182306; reg office 70 Sir John Rogerson’s Quay, Dublin 2, Ireland; reg company no. 629188).
- Hong Kong by First Sentier Investors (Hong Kong) Limited and has not been reviewed by the Securities & Futures Commission in Hong Kong. First Sentier Investors, FSSA Investment Managers, Stewart Investors, RQI Investors and Igneo Infrastructure Partners are the business names of First Sentier Investors (Hong Kong) Limited.
- Singapore by First Sentier Investors (Singapore) (reg company no. 196900420D) and this advertisement or material has not been reviewed by the Monetary Authority of Singapore. First Sentier Investors (registration number 53236800B), FSSA Investment Managers (registration number 53314080C), Stewart Investors (registration number 53310114W), RQI Investors (registration number 53472532E) and Igneo Infrastructure Partners (registration number 53447928J) are the business divisions of First Sentier Investors (Singapore).
- United Kingdom by First Sentier Investors (UK) Funds Limited, authorised and regulated by the Financial Conduct Authority (reg. no. 2294743; reg office Finsbury Circus House, 15 Finsbury Circus, London EC2M 7EB).
- United States by First Sentier Investors (US) LLC, authorised and regulated by the Securities Exchange Commission (RIA 801-93167).
- other jurisdictions, where this document may lawfully be issued, by First Sentier Investors International IM Limited, authorised and regulated in the UK by the Financial Conduct Authority (FCA ref no. 122512; Registered office: 23 St. Andrew Square, Edinburgh, EH2 1BB; Company no. SC079063).
To the extent permitted by law, MUFG and its subsidiaries are not liable for any loss or damage as a result of reliance on any statement or information contained in this document. Neither MUFG nor any of its subsidiaries guarantee the performance of any investment products referred to in this document or the repayment of capital. Any investments referred to are not deposits or other liabilities of MUFG or its subsidiaries, and are subject to investment risk, including loss of income and capital invested
© First Sentier Investors Group
IMPORTANT INFORMATION
This document has been prepared by Count Limited (Count) ABN 11 126 990 832. While care has been taken in the preparation of this market update, no liability is accepted by Count, its related entities, agents and employees for any loss arising from reliance on this market update.


Connect with WSC Group