January 2025
Economic and Market Overview
- Global: The introduction of DeepSeek’s open-source R1 model shocked global markets in January, challenging our understanding of capex requirements and competition in artificial intelligence.
- Despite the DeepSeek rout, the MSCI World Equity Index still ended January +3.5% higher, led by strength in European equities as investors rotated out of US tech exposures and into defensive and high growth European names.
- Global risk-off sentiment saw US 10y Treasury yields end the month 3bps lower and 2y UST yields -4.5bps. The move also came as the market began to push out the timing of Fed cuts and became increasingly concerned around the inflationary impacts of Trump’s potential trade policies.
- At the tail-end of the month, the market shifted its focus to the implementation of the tariffs on Canada, Mexico and China. The market knows there are likely to be both permanent revenuegenerating tariffs and temporary bargaining tool tariffs, but the challenge is to understand the difference and the implications for markets.
Elsewhere, global PMIs in December continued to highlight a divergence between still robust services and languishing manufacturing activity. The global manufacturing PMI remains just shy of 50, straddling expansion and contraction. Meanwhile the global services gauge remains expansionary at 53.8.
US: The December FOMC Meeting Minutes underscored the hawkish undertones delivered at the meeting itself. Federal Reserve officials expressed increased concern around “potential changes in trade and immigration policy” that could result in upside inflationary risks.
- Subsequently, non-farm payrolls data showed that the US added 256,000 new jobs in December, well above consensus expectations of 165,000. The unemployment rate also fell from 4.23% to 4.09%, prompting the market to re-evaluate the magnitude and timing of US interest rate cuts in 2025.
- However, following this, core CPI came in at 0.225% MoM, below consensus expectations at 0.3%.
- Donald Trump was inaugurated on the 20th of January, and soon after signed a slew of Executive Orders (26 on his first day), ranging from withdrawal from the World Health Organisation to declaring an energy emergency and winding back Biden-era policies that favoured renewable energy.
- Following his inauguration, Trump announced a raft of tariffs on Canada, Mexico and later China before backing down and saying he would direct federal agencies to review trade relations and policies. He also singled out copper, aluminium and steel for targeted tariff hikes.
- At the FOMC meeting in the back end of the month, the Fed opted to leave interest rates on hold, as widely expected. Fed Chair Powell remarked that rates were in a "good place" and indicated that the Committee would be taking a "wait and see" approach going forward.
On 31 January after-market, Donald Trump signalled 25% tariffs on Canadian and Mexican goods and 10% tariffs on Chinese imports, which would take effect from February 1. In response, Canada retaliated with a 25% counter-tariff, Mexico planned countermeasures, and China vowed a WTO complaint.
Australia: The November CPI print showed that monthly trimmed-mean inflation decelerated from 3.5% to 3.2%. While services and housing inflation continued the downward trend, electricity prices surprised to the upside after various subsidies came off.
- Retail sales data was the next notable print of the month. The monthly retail trade increase of +0.8% was below consensus estimates of +1.0%, though upward revisions were made to prior month, meaning the October print was 0.2pp stronger than previously reported.
- The labour force survey was stronger-than-expected, with 56.3k jobs added in December (vs the 15.0k consensus assumption). The unemployment rate rose by 0.1pp to 4.0% as expected.
The quarterly CPI print at the end of the month saw several market participants bring forward RBA cut expectations. The trimmed-mean measure printed at 0.5% (vs 0.6% consensus). This was driven by a deceleration in housing, with both construction costs and rental inflation easing more than expected. Post-CPI, the market all but fully priced a Feb cut.
New Zealand: The main macro data point this month was NZ's quarterly inflation print on Jan 22, which came in at +0.5%; inline with consensus but lower than the previous +0.6% reading. The +2.2% YoY reading marks the first-time annual inflation has stuck in the target band for two quarters running in four years
Europe: EU unemployment remained steady in December at 6.3%, in-line with consensus expectations. Of the Euro Area members, Spain reported the highest unemployment rate at 10.6% while Germany recorded the lowest reading at 3.4%.
- In the UK, 10-year gilt yields reached their highest level since August 2008 at the beginning of January amid concerns around government debt and stubborn inflation in the area. However, the spike largely evaporated with yields shifting lower later in the month following an unexpected fall in British retail sales.
- Mid-month saw EU inflation print in-line with expectations at +2.4% YoY. The print is higher than November’s +2.2% increase, with energy and services shifting the gauge higher. Inflation continues to hover just above the ECB's 2% target, despite four interest rate cuts last year.
The ECB cut rates in a widely anticipated move and signalled further rate cuts with the
China: Both CPI and PPI ended 2024 with soft readings, in line with market expectations. However, the December Services PMI print at 52.2 beat expectations of 51.5, suggesting some improvement in the Chinese economy.
- This was then solidified by the GDP print which came in at +5.4%, ahead of consensus estimates of +5.0%. A retail sales beat pointed to a further pickup on the supply side.
- December trade data also came in above expectations for imports and exports. Exports rose +10.7% (vs consensus at +7.3%), though this beat came as US tariff risks loomed, with some attributing the beat to a frontloading of shipments.
- Trump indicated that he would not impose tariffs on China on Day 1 of his time in office but said he would direct federal agencies to review trade relationships and policies. Tariffs taking effect on Feb 1 were later announced.
- At the end of January, both manufacturing and nonmanufacturing PMIs missed expectations.
Australian dollar
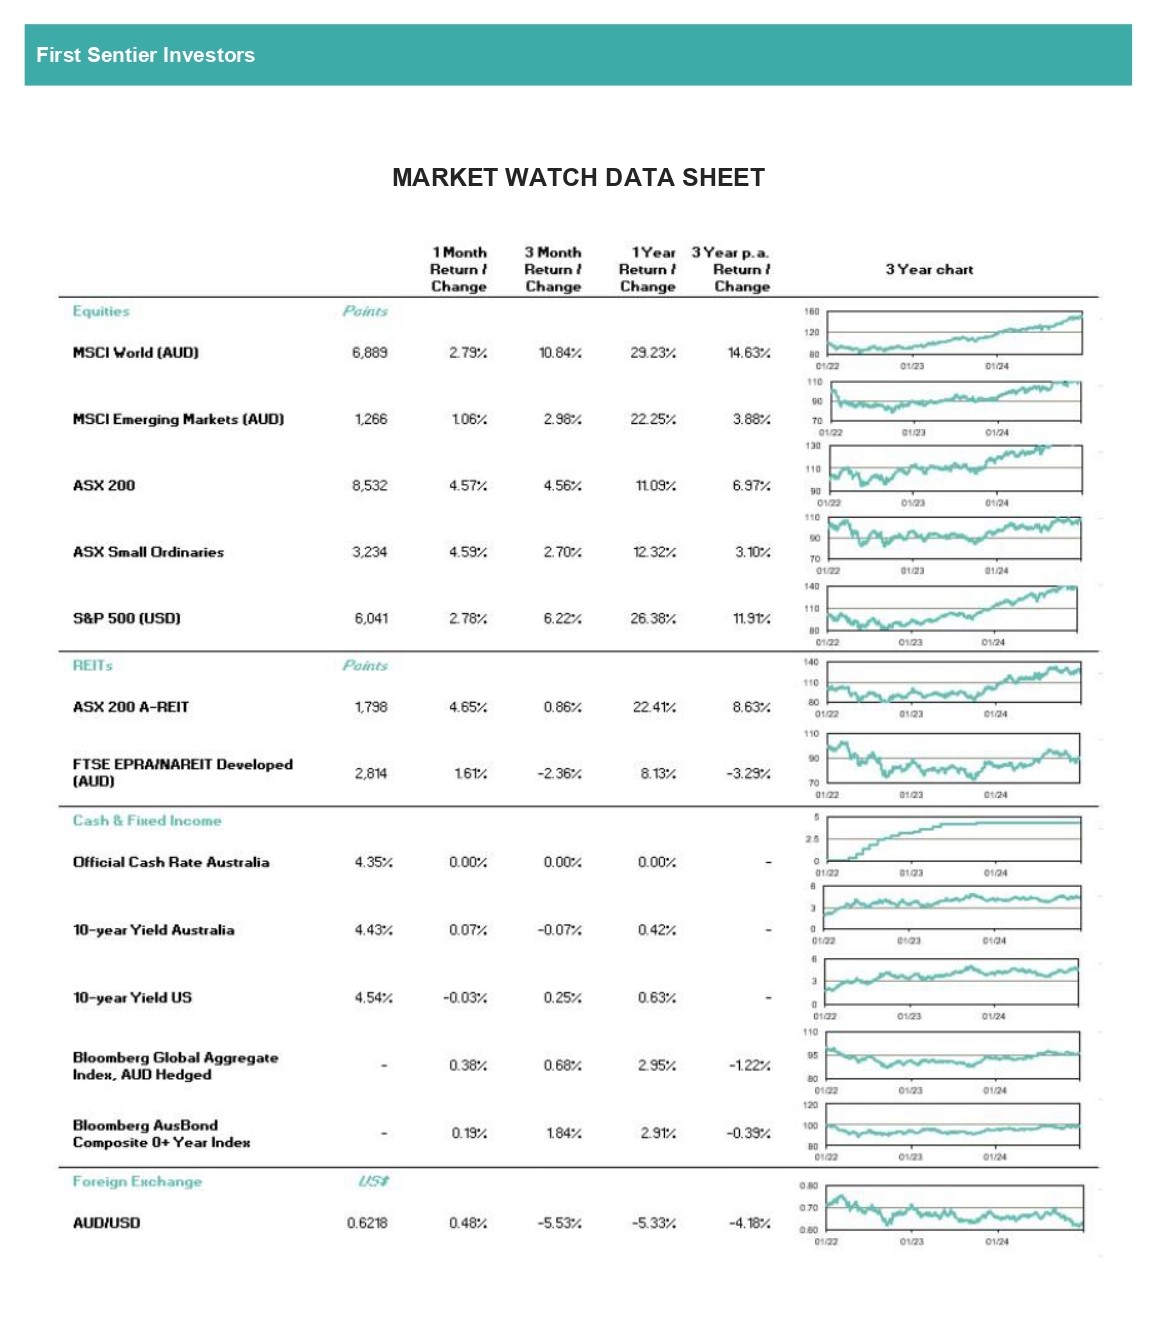
- After posting a -5.0% decline against the USD in December, the Australian dollar ended January at 0.6218, +0.50% on the month.
- The AUD hit a monthly low of 0.6147 on January 10 as the USD gained on a round of solid US economic releases, as well as AU CPI showing further progress on inflation, supporting the case for a Feb RBA rate cut.
- The AUD then strengthened on reports that there may be a gradual approach to tariffs from the Trump administration. Soft US inflation data and a ceasefire in the Middle East also provided a solid boost to risk sentiment. The AUD hit its monthly high of 0.6314 on 24 January.
- The domestic currency then turned around to finish the month at 0.6218 after risk assets faltered off the back of DeepSeek fears. The domestic CPI also showed clear signs
Australian equities
- The S&P/ASX200 advanced +4.6% in January, led by gains in the consumer discretionary and financials GICS sectors. The gains came as Trump’s inauguration inspired risk-on sentiment across global markets, and as a softer domestic inflation print in Q4 heightened expectations of an RBA interest rate cut in February.
- The local bourse ended the month at 8,532 points; a record closing high for the index.
- The consumer discretionary sector rallied +7.1% in January, making it the top performing sector in the ASX during January. Notably, JBH added +9.5% over the month and exceeded the $100 level, continuing to create new price highs. Peers HVN (+11.4%), ALL (+10.6%) and WES (+7.1%) also posted solid gains.
- The financials sector observed yet another month of robust growth, with the sector gauge rising +6.1% over the course of January. The big 4 banks all gained ground despite having made record gains in 2024. In January, NAB added +8.2%, ANZ +7.3%, CBA +4.8% and WBC +4.4%.
- Gold names fared well in January as the precious metal extended gains. The bullion closed the month near US$2,800/oz. Beneficiaries included Newmont (+16.2%), Northern Star (+12.1%) and Evolution Mining (+18.5%).
- Of the large-cap iron ore miners, FMG saw the largest gains, rising +4.8% in January. BHP ended the month just over +1% higher, while RIO closed near flat.
- Meanwhile, utilities were the only GICS sector to end the month in negative territory, down -2.4%. This was led by a -4.1% decline in Origin Energy which fell following its 2Q result at the end of the month. While the APLNG segment reported largely in-line numbers, the downgrade to FY25 production guidance on field performance saw the stock down -6.7% on the day of the release.
Global equities
- Global equity markets gained ground in the first month of 2025; with the MSCI World Index ending January +3.5% higher than it started.
- European equities saw especially strong gains to start the year. The Stoxx600 advanced +6.3%, its best performance since November 2023, and the FTSE100 gained +6.1%, its best performance since November 2022. The outperformance came as investors rotated out of US tech exposures and into both defensive and high growth European names.
- Sartorius saw the largest percentage gain of the Stoxx constituents, gaining >30% after posting its 4Q result. Other notable gainers included Hermes (+17.3%), SAP SE (+13.6%), EssilorLuxottica (+12.8%) and Sanofi (+11.4%).
- The US market also trended upwards a despite the DeepSeekled setback in January’s final week.The S&P500 gained +2.7%, the Dow Jones rose +4.7% and the tech-heavy NASDAQ posted a +2.2% monthly increase despite the DeepSeek rout.
- Asian equity markets also observed gains in January for the most part. The MSCI Asia Pacific Index was +1.4% higher by month-end. Korea’s Kospi benchmark advanced +4.9% while the Hang Seng inched up +0.8%. The Nikkei 225 slipped -0.8%, while the broader Topix index inched up +13bps.
Property securities
- The FTSE EPRA/NAREIT Developed Total Return Index increased 1.4% in USD terms as global bond yields normalised, following rate cuts.
- Europe/UK was the best performing region in January up 3.2%.
- On the other hand, Middle East & Africa was down modestly - 0.3% following a strong 2024 year with 25%+ returns.
- The Americas region was up 1.1%, slightly underperforming global average.
- Locally, A-REITs were up ~5% as timing for
Fixed income and credit
- The FOMC meeting saw rates left on hold, as expected, with some seemingly hawkish changes to the statement dismissed by Chair Powell as “language cleanup” in the press conference. The Fed Committee indicated that rates were in a “good place” and that there was no hurry to adjust the policy stance. There was a small ~ 3bps sell-off across the curve post-meeting.
- Mid-month, the announcement of DeepSeek’s R1 model saw risk-off sentiment initially take hold. This risk-off mood was exacerbated as the market grew concerned around the inflationary nature of potential trade and fiscal policies that could be implemented by Trump’s administration. A global rates rally ensued as the market began to push out the timing of Fed cuts to later in the year. 10y UST yields ultimately ended the month 3bps lower while the 2y UST ended down 4.5bps.
- Over the Atlantic, 2y bund yields rose 23bps in the first half of the month amid long-term fiscal concerns, but subsequently fell at the back end of the month post the ECB meet, resulting in a monthly change of +4bps. While the ECB lowering interest rates by 25bps was fully priced in by the market, Lagarde’s hinting around further cuts came as somewhat of a dovish surprise.
- Domestically, the AU CPI print solidified the disinflation trend in underlying inflation. Following its release, the market began to price in a higher likelihood of a February RBA cut; with 23bps priced in for the February meeting at the end of January vs 18bps at the end of December 2024.
- Aussie bond yields followed the global AI induced rally to begin the month, before reversing following a stronger-than-expected US NFP print which sparked a global selloff. 2y Aussie bonds ultimately rallied 6bps on the month, while 10y Aussie bonds sold off 2bps as curves steepened amid expectations of both AU and global rate cutting cycles.
- Credit markets generally performed well to start the year. In the US, credit cash benchmarks closed the month at +79bps (-1bp tighter), and CDX IG similarly tightened ~1.5bp. CDX HY was up ~30cts. Supply-wise, $IG printed ~190bn while HY saw ~20bn+ in primary on revived M&A activity. In Europe, Itraxx Main finished -4.5bps tighter and XOVER ~25bps tighter. European issuance was ~€330bn, just shy of last year’s record volumes.
Important information
This material is for general information purposes only. It does not constitute investment or financial advice and does not take into account any specific investment objectives, financial situation or needs. This is not an offer to provide asset management services, is not a recommendation or an offer or solicitation to buy, hold or sell any security or to execute any agreement for portfolio management or investment advisory services and this material has not been prepared in connection with any such offer. Before making any investment decision you should consider, with the assistance of a financial advisor, your individual investment needs, objectives and financial situation.
We have taken reasonable care to ensure that this material is accurate, current, and complete and fit for its intended purpose and audience as at the date of publication. No assurance is given or liability accepted regarding the accuracy, validity or completeness of this material and we do not undertake to update it in future if circumstances change.
To the extent this material contains any expression of opinion or forward-looking statements, such opinions and statements are based on assumptions, matters and sources believed to be true and reliable at the time of publication only. This material reflects the views of the individual writers only. Those views may change, may not prove to be valid and may not reflect the views of everyone at First Sentier Investors.
About First Sentier Investors
References to ‘we’, ‘us’ or ‘our’ are references to First Sentier Investors, a global asset management business which is ultimately owned by Mitsubishi UFJ Financial Group. Certain of our investment teams operate under the trading names FSSA Investment Managers, Stewart Investors, Realindex Investments and Igneo Infrastructure Partners, all of which are part of the First Sentier Investors group. We communicate and conduct business through different legal entities in different locations. This material is communicated in:
- Australia and New Zealand by First Sentier Investors (Australia) IM Ltd, authorised and regulated in Australia by the Australian Securities and Investments Commission (AFSL 289017; ABN 89 114 194311).
- European Economic Area by First Sentier Investors (Ireland) Limited, authorised and regulated in Ireland by the Central Bank of Ireland (CBI reg no. C182306; reg office 70 Sir John Rogerson’s Quay, Dublin 2, Ireland; reg company no. 629188).
- Hong Kong by First Sentier Investors (Hong Kong) Limited and has not been reviewed by the Securities & Futures Commission in Hong Kong. First Sentier Investors, FSSA Investment Managers, Stewart Investors, Realindex Investments and Igneo Infrastructure Partners are the business names of First Sentier Investors (Hong Kong) Limited.
- Singapore by First Sentier Investors (Singapore) (reg company no. 196900420D) and this advertisement or material has not been reviewed by the Monetary Authority of Singapore. First Sentier Investors (registration number 53236800B), FSSA Investment Managers (registration number 53314080C), Stewart Investors (registration number 53310114W), Realindex Investments (registration number 53472532E) and Igneo Infrastructure Partners (registration number 53447928J) are the business divisions of First Sentier Investors (Singapore).
- Japan by First Sentier Investors (Japan) Limited, authorised and regulated by the Financial Service Agency (Director of Kanto Local Finance Bureau (Registered Financial Institutions) No.2611)
- United Kingdom by First Sentier Investors (UK) Funds Limited, authorised and regulated by the Financial Conduct Authority (reg. no. 2294743; reg office Finsbury Circus House, 15 Finsbury Circus, London EC2M 7EB).
- United States by First Sentier Investors (US) LLC, authorised and regulated by the Securities Exchange Commission (RIA 801-93167)
- other jurisdictions, where this document may lawfully be issued, by First Sentier Investors International IM Limited, authorised and regulated in the UK by the Financial Conduct Authority (FCA ref no. 122512; Registered office: 23 St. Andrew Square, Edinburgh, EH2 1BB; Company no. SC079063)
To the extent permitted by law, MUFG and its subsidiaries are not liable for any loss or damage as a result of reliance on any statement or information contained in this document. Neither MUFG nor any of its subsidiaries guarantee the performance of any investment products referred to in this document or the repayment of capital. Any investments referred to are not deposits or other liabilities of MUFG or its subsidiaries, and are subject to investment risk, including loss of income and capital invested
© First Sentier Investors Group
IMPORTANT INFORMATION
This document has been prepared by Count Limited (Count) ABN 11 126 990 832. While care has been taken in the preparation of this market update, no liability is accepted by Count, its related entities, agents and employees for any loss arising from reliance on this market update. Count advisers are authorised representatives of Count.


Connect with WSC Group